

Have you ever wondered how to track bus locations in real-time? Do you know how transit agencies track where all shared scooters are at any given time? Or how to better analyze crash data in Los Angeles?
These are all projects that UCLA Luskin graduate students are working on as a way to increase their data coding and analysis skills.
The UCLA Institute of Transportation Studies hosted a four-day data camp for urban planning students this September. The goal of the workshop was to teach students how to use Python, a simple programming language, and related tools to process, analyze, and visualize data that would enhance their transportation planning and policy careers. Students with minimal prior knowledge gained valuable skills, including how to pull, analyze and visualize e-scooter data from LA Metro. The camp was taught by Tim Black MURP ‘14, a former data analyst at the Los Angeles Department of Transportation and currently a data scientist at NBC Universal.
As an extension of the camp, ITS has continued hosting monthly data hack nights for urban planning students interested in building their proficiency and to give students a space to work on their data projects on an ongoing basis.
Juan Matute, deputy director of UCLA ITS, first came up with the idea of data camp and hack nights after noticing increasing demand from students for specific data skills.
“We’re seeing a rising need for transportation planners to be able to leverage data skills both academically and in the professional world,” Matute said.
“Data camp offered students a way to quickly learn these skills and opened the door for them to pursue these interests further either in data hack nights or in data analysis careers.”
Prior to attending data camp, Eric Dasmalchi, a first-year urban planning student, had only taken one data science class as an undergraduate. He hadn’t been fine-tuning the skills since then. Today, he’s building out a real-time bus map.
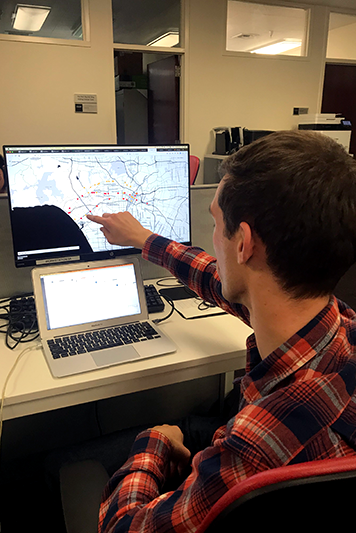
Eric Dasmalchi demonstrates his real-time bus map data project
To build the map of both local and rapid buses in LA Metro, Dasmalchi programmed a spreadsheet to “ask” the transit agency for exact bus locations every two minutes. Once the spreadsheet was set up, he transferred the data to the map.
What are the applications of this map for transit professionals? “Transit agencies can examine it to analyze on-time arrival performance, compare travel times between local buses and rapid buses and determine how many rapid buses pass local buses on a daily basis,” Dasmalchi said.
Since gaining more experience through the data camp and data hack nights, Dasmalchi has started working at ITS as a graduate student researcher, focused on creating data reports. Currently, he’s making a visualization tool to compare transit ridership per capita across urban areas in the United States. The graphs use passenger trip data from transit agencies combined with population data from the census. This visualization tool can help transit agencies compare how their ridership has fared over time but also how they’re doing compared with other cities. Dasmalchi plans to continue perfecting his visualization tool so that ITS can present it to other transportation professionals.
Students interested in learning more about data hack nights can contact us.

